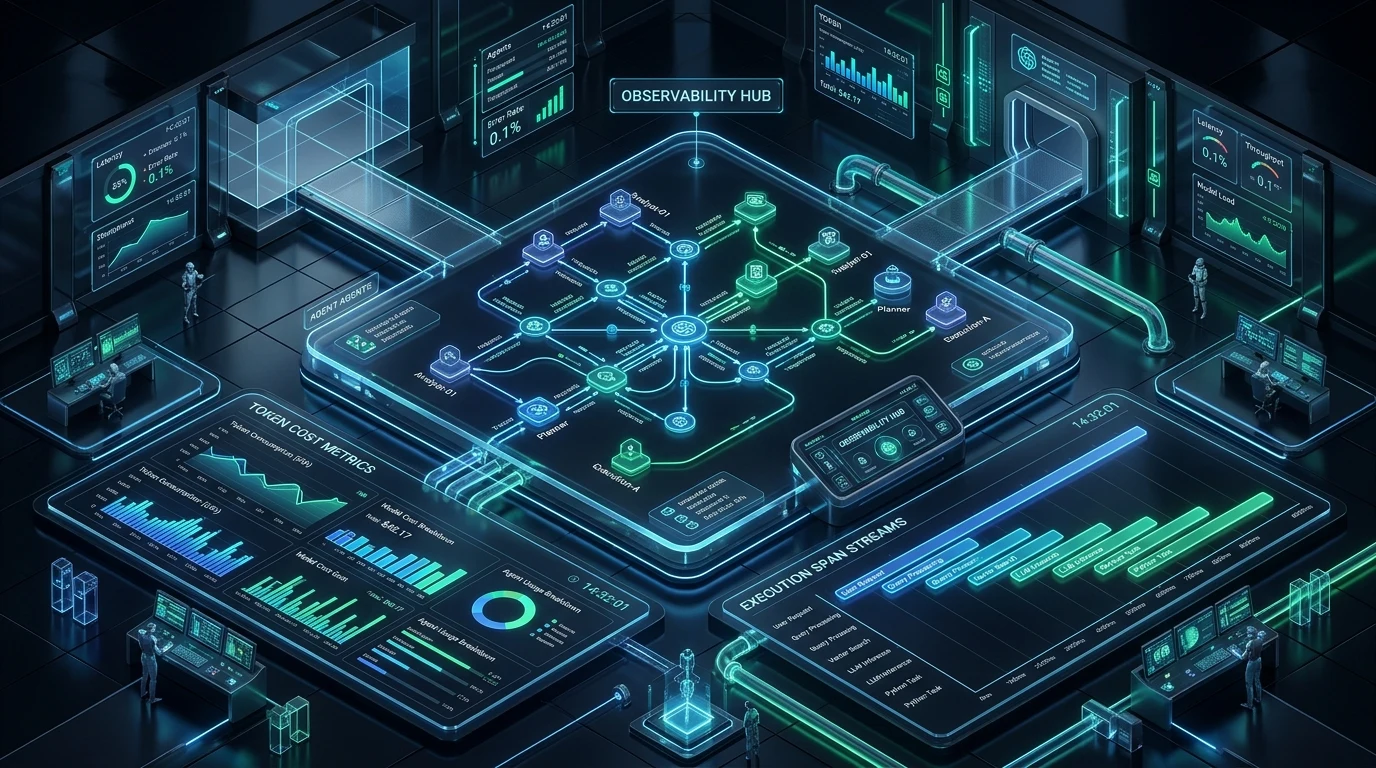
Running autonomous agentic loops in production without granular tracing is like running distributed microservices with standard output turned off. When an agent receives a single prompt and executes 14 tool calls, 3 nested vector queries, and an asynchronous summarizer, a generic HTTP 500 error tells you absolutely nothing about why the model failed.
In practice, modern AI failures almost never happen at the HTTP transport layer. They happen when a model outputs malformed JSON on Step 6, hallucinates an invalid parameter for an API tool, or enters a 10-cycle circular reasoning loop. When evaluating telemetry stacks, the decision usually comes down to LangSmith (LangChain's managed, developer-centric platform) vs Arize Phoenix (the OpenTelemetry-native, self-hostable open-source engine). Here is what actually happens when you push both to production.
TL;DR Comparison: LangSmith vs Arize Phoenix
| Evaluation Vector | LangSmith (Managed SaaS) | Arize Phoenix (OSS / Self-Hosted) |
|---|---|---|
| Pricing Model | $39/mo (Plus base) + $0.005/trace overages | 100% Free Open Source (Flat VPS cost) |
| Deployment Options | Managed Cloud SaaS (Enterprise VPC available) | Local Docker, Kubernetes, or Private VPS |
| Telemetry Standard | Proprietary LangChain RunTree SDK | OpenTelemetry Standard (OTel / OpenInference) |
| Framework Flexibility | First-class for LangChain & LangGraph | Agnostic (LangChain, LlamaIndex, DSPy, CrewAI, Raw APIs) |
| Trace Ingestion Overhead | ~140ms – 400ms (Cloud HTTPS round-trip) | < 20ms (Local Docker bridge / LAN network) |
| Ideal Use Case | Early prototyping & pure LangGraph architectures | High-volume production, strict data privacy, zero vendor lock-in |
In our workloads averaging 6–8 spans per multi-agent run, that ingestion latency gap (140–400ms cloud round-trip vs <20ms on a local Docker bridge) becomes brutally obvious when live-debugging an agent loop at 2 a.m. More importantly: once your monthly trace volume crosses 50,000 runs, the pricing delta between a flat $10 Hetzner VPS and usage-based SaaS overage tiers stops being a rounding error and starts showing up painfully on your credit card statement.
The Observability Gap in Modern Agent Stacks
Traditional monitoring tools like Sentry, Datadog, or Prometheus are great at catching unhandled exceptions and server saturation. But they don't understand semantic token drift, prompt template interpolation, or tool argument hallucinations.
When an agent fails in production, it usually returns an HTTP 200 with garbage data or an empty array. Without parent-child span hierarchies that capture the raw system prompt, input tokens, intermediate tool outputs, and LLM reasoning steps, reproducing bugs in local development is nearly impossible.
+─────────────────────────────────────────────────────────────────────────────+
|                    PRODUCTION AGENT OBSERVABILITY FLOW                      |
+─────────────────────────────────────────────────────────────────────────────+
|                                                                             |
|   [User Ingestion] ──▶ [Multi-Agent Orchestrator (LangGraph / CrewAI)]      |
|                                │                                            |
|                                ▼                                            |
|                     ┌────────────────────┐                                  |
|                     │ Agent Decision Loop│                                  |
|                     └─────────┬──────────┘                                  |
|                               │                                             |
|        ┌──────────────────────┼──────────────────────┐                      |
|        ▼                      ▼                      ▼                      |
|  [Step 1: Vector RAG]  [Step 2: Custom Tool]  [Step 3: Synthesis]           |
|        │                      │                      │                      |
|        └──────────────────────┼──────────────────────┘                      |
|                               ▼                                             |
|                   [Telemetry Instrumentation]                               |
|                               │                                             |
|              ┌────────────────┴────────────────┐                            |
|              ▼                                 ▼                            |
|   ┌─────────────────────┐           ┌─────────────────────┐                 |
|   │ LangSmith (SaaS)    │           │ Arize Phoenix (OSS) │                 |
|   │ • Managed Dashboard │           │ • OpenTelemetry     │                 |
|   │ • 1-Click Playground│           │ • Self-Hosted VPS   │                 |
|   │ • $514/mo at 100k   │           │ • $12/mo flat VPS   │                 |
|   └─────────────────────┘           └─────────────────────┘                 |
+─────────────────────────────────────────────────────────────────────────────+
LangSmith: Unmatched Developer Experience for LangChain
LangSmith is built natively into the LangChain and LangGraph ecosystem. If your entire stack is written in LangGraph, turning on observability takes less than 30 seconds: export three environment variables, and every single step is logged automatically with zero code modifications.
Why Engineers Love LangSmith:
- Zero-Friction Auto-Instrumentation: Setting
LANGSMITH_TRACING_V2=trueautomatically traces chains, agent graphs, and tool calls without manual span wrappers. - Interactive Prompt Playground: When an agent hallucinates in production, you can open that exact execution in the cloud playground, adjust the system prompt or model parameters, and re-run the trace instantly to verify a fix.
- Built-In Evaluation Datasets: You can bookmark real production failures directly from the trace stream and convert them into automated test cases for CI/CD pipelines.
Standard LangSmith Setup (Python):
import os
from langchain_openai import ChatOpenAI
from langchain_core.prompts import ChatPromptTemplate

# Enable LangSmith Zero-Configuration Tracing
os.environ["LANGSMITH_TRACING_V2"] = "true"
os.environ["LANGSMITH_ENDPOINT"] = "https://api.smith.langchain.com"
os.environ["LANGSMITH_API_KEY"] = "lsv2_pt_..."
os.environ["LANGSMITH_PROJECT"] = "production-finops-agent"

model = ChatOpenAI(model="gpt-4o", temperature=0)
prompt = ChatPromptTemplate.from_template("Analyze operational costs for: {company}")
chain = prompt | model

# All child spans, token usages, and latencies are streamed to LangSmith Cloud
response = chain.invoke({"company": "Enterprise Logistics Corp"})
The Real-World Catch: LangSmith is fantastic during development. But once you scale past 50,000 monthly multi-step agent runs, the $0.005 per-trace overage fee adds up quickly. If your pipeline splits one customer request into 10 sub-traces, your monthly bill jumps by hundreds of dollars without any added compute value.
Arize Phoenix: OpenTelemetry Standards & Zero Data Egress
Arize Phoenix approaches observability from an open-source, standard-first perspective. It is built entirely on the OpenTelemetry (OTel) protocol and OpenInference semantic conventions. Traces are stored in your own infrastructure, so sensitive customer prompts never leave your private server.
Key Architectural Advantages of Arize Phoenix:
- Framework-Agnostic Tracing: Native instrumentation for LangChain, LlamaIndex, DSPy, CrewAI, AutoGen, and raw OpenAI / Anthropic SDK calls.
- Flat Self-Hosted Cost: Host the complete Phoenix collector and UI on a lightweight $12/month VPS with zero per-trace limits.
- Full Data Ownership & Privacy: Crucial for HIPAA, GDPR, or SOC2 compliance where sending user conversation data to a third-party SaaS is prohibited.
- OTel Standard Pipeline: You can export spans simultaneously to Phoenix, Jaeger, and Grafana Tempo using standard OpenTelemetry collectors.
Production Docker Compose for Arize Phoenix:
# docker-compose.yml: Self-Hosted Arize Phoenix on Private VPS
version: '3.8'

services:
  phoenix:
    image: arizephoenix/phoenix:latest
    container_name: phoenix-observability
    restart: unless-stopped
    ports:
      - "6006:6006"   # Web UI & REST API
      - "4317:4317"   # OpenTelemetry gRPC Receiver
      - "4318:4318"   # OpenTelemetry HTTP Receiver
    environment:
      - PHOENIX_PORT=6006
      - PHOENIX_GRPC_PORT=4317
      - PHOENIX_WORKING_DIR=/data
    volumes:
      - ./phoenix_storage:/data
Production Instrumentor Pattern with Asynchronous Batch Processing:
import os
from openinference.instrumentation.langchain import LangChainInstrumentor
from openinference.instrumentation.openai import OpenAIInstrumentor
from opentelemetry import trace as trace_api
from opentelemetry.exporter.otlp.proto.http.trace_exporter import OTLPSpanExporter
from opentelemetry.sdk.trace import TracerProvider
from opentelemetry.sdk.trace.export import BatchSpanProcessor

# Connect to Local or Private VPS Phoenix Endpoint
phoenix_endpoint = os.getenv("PHOENIX_COLLECTOR_URL", "http://localhost:6006/v1/traces")

tracer_provider = TracerProvider()
# Pro-tip: Always use BatchSpanProcessor in production to avoid blocking the agent event loop
span_processor = BatchSpanProcessor(OTLPSpanExporter(endpoint=phoenix_endpoint))
tracer_provider.add_span_processor(span_processor)
trace_api.set_tracer_provider(tracer_provider)

# Auto-instrument frameworks
LangChainInstrumentor().instrument()
OpenAIInstrumentor().instrument()
Production Benchmark: 100k Traces TCO Comparison (2026 Data)
Here is what the real monthly cost looks like for a production system processing 100,000 multi-step traces per month (averaging 6 child spans per trace):
| Cost & Performance Metric | LangSmith (Managed Cloud) | Arize Phoenix (Self-Hosted VPS) |
|---|---|---|
| Base Platform Fee | $39 / month (1 seat included) | $0 / month (Open Source) |
| 100k Trace Ingestion Volume Fee | $475 / month ($0.005/trace after free allowance) | $0 (Unlimited Traces) |
| Server / VPS Hosting Overhead | $0 (Included in SaaS) | $12 / month (2 vCPU, 4GB RAM VPS) |
| Total Monthly TCO (100k Traces) | $514 / month ($6,168/year) | $12 / month ($144/year) |
| Trace Egress Latency Penalty | ~140ms – 400ms per root trace span | < 20ms (Internal Docker LAN network) |
The FinOps Reality: Moving 100k monthly traces from LangSmith to self-hosted Arize Phoenix cuts telemetry spend from $514/mo to $12/mo — a 97.7% TCO reduction with zero loss in span depth.
Architectural Decision Matrix: Which One to Choose?
Use LangSmith if:
- Your codebase is strictly standard LangGraph / LangChain.
- You have a small team (< 25,000 monthly traces) and want zero infrastructure management.
- Your product managers and prompt engineers need the interactive web playground to iterate on prompt regressions.
Use Arize Phoenix if:
- You process over 50,000 traces per month and want to avoid unpredictable SaaS overage invoices.
- You are bound by strict data governance rules (GDPR, HIPAA, SOC2) and cannot send raw customer prompts to third-party endpoints.
- You mix multiple frameworks like CrewAI, AutoGen, and custom Python microservices with OpenTelemetry instrumentation.
Frequently Asked Questions
1. Can Arize Phoenix trace local models running on Ollama?
Yes. Because Phoenix uses OpenInference and standard OpenTelemetry spans, it captures prompt token counts, generation times, and completion latency from local Ollama, vLLM, or LM Studio instances without needing an active internet connection.
2. Does LangSmith work with frameworks other than LangChain?
Yes. LangSmith offers a generic @traceable decorator in Python and TypeScript. However, you will have to manually annotate custom tool spans, whereas LangGraph handles the full DAG hierarchy out of the box.
3. Why should I use BatchSpanProcessor instead of SimpleSpanProcessor in production?
SimpleSpanProcessor sends an HTTP request synchronously for every single span created, which slows down your agent's execution loop by 50–150ms per tool call. BatchSpanProcessor aggregates spans in background memory and flushes them periodically, reducing latency impact to near zero.